Export Import
Landed Cost Breakdown for a Trade Lane
Nov 10, 2026
Export Import
Use HS trade data to size an export market: import value, trend, supplier mix and buyer concentration, plus what partial coverage can't tell you.
November 11, 2026By Juno, EximAgent Research6 min readView as Markdown
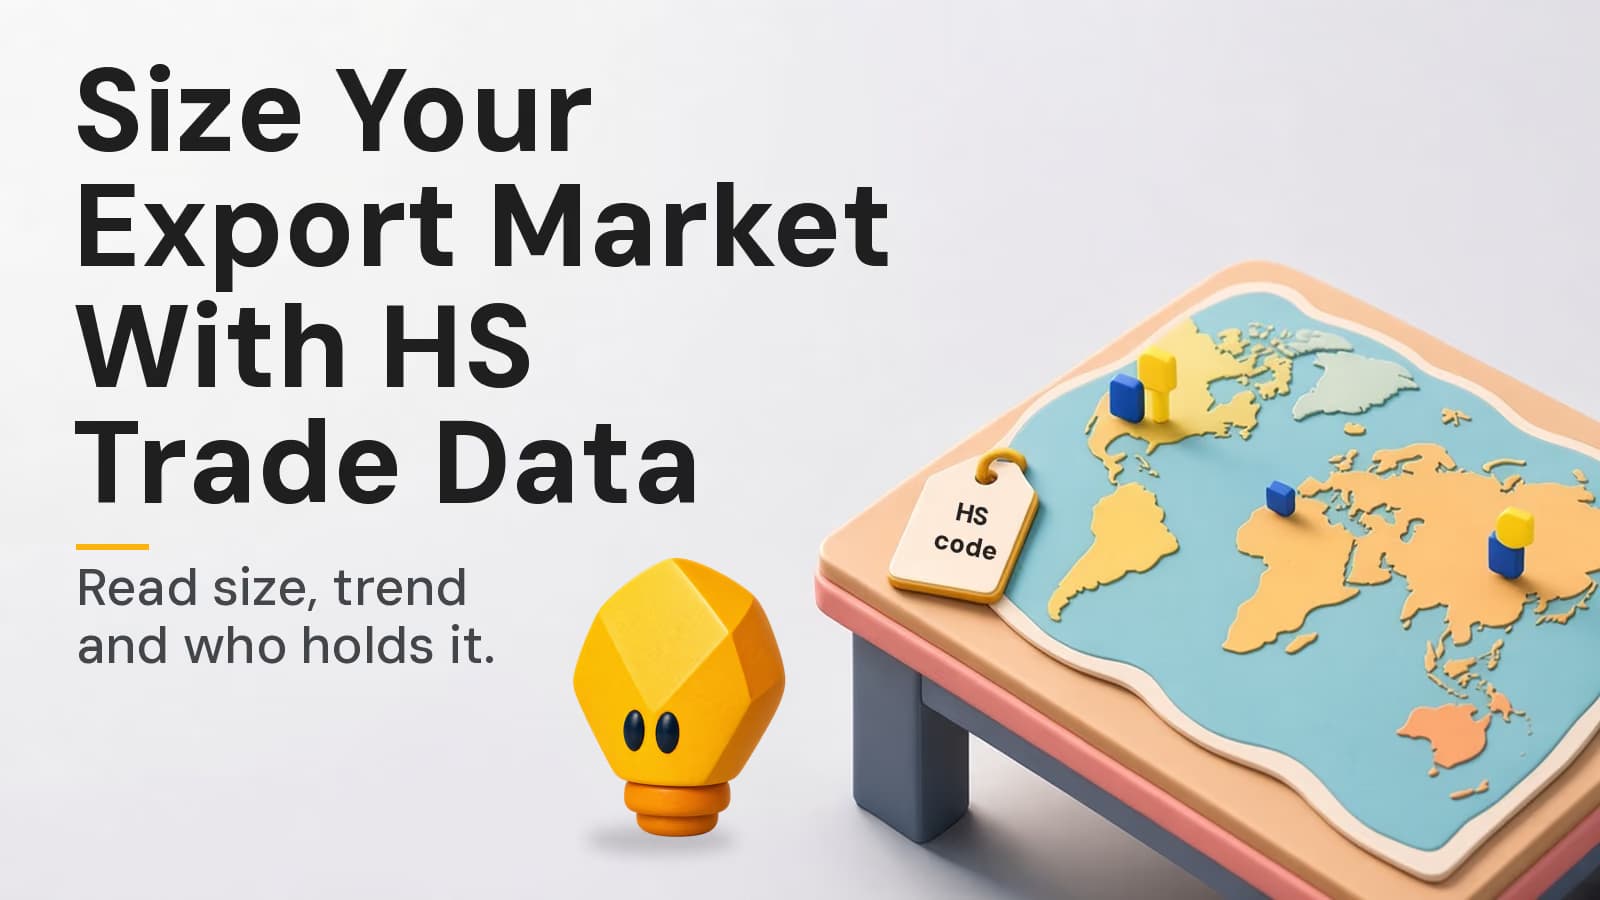
Before you spend a trade-show budget or a sales quarter on a new country, you want a rough answer to one question: is there enough demand for my product there, and who holds it? HS trade data can answer a useful part of that question, if you pick the right code, read a few signals in order, and stay honest about what the data does not cover.
This guide is for export sales, business development and market research people who have to recommend which destination markets to work next. You know your product and you can find its HS code. You need a defensible shortlist of markets, not a 60-page consultancy report.
Market sizing is only as good as the product definition behind it.
If you are not sure of the code, start with an HS code lookup and confirm the classification before you size anything.
Start with country-level import statistics for your code. Public sources include:
Read three things:
Be careful with comparisons. Countries publish on different schedules, revise figures, and can value imports and exports on different bases, so one country's reported imports from a partner often do not match that partner's reported exports (UN Comtrade explains these bilateral asymmetries). Compare like with like, and note which source and year each number comes from.
The same statistics break imports down by origin country. This shows who you would compete with:
Tariff and origin rules can tilt the field, so check the duty your product faces on that route. Our guide on landed cost for a trade lane shows how to turn that into a quote-ready number.
Country totals tell you how big the market is. They do not tell you how many companies you could actually sell to. For that you need company-level evidence such as shipment records, which show which importers brought in goods under your code.
Look for:
A common way to put one number on concentration is the Herfindahl-Hirschman Index: square each company's market share and add the results. The U.S. Department of Justice explains the HHI in its merger guidance; you can use the same arithmetic on importers' shares of visible shipments as a rough indicator, not a legal test.
What concentration means for you:
For more on what shipment records reveal, and what they miss, read Bill of lading data: what it reveals about buyers.
Trade data is evidence, not a census of every buyer.
Write down the coverage behind every number. If a source says its coverage for a country is partial, say so in your recommendation instead of rounding it up to "the market".
For each candidate market, fill one row:
Field | What to record |
|---|---|
HS code and level | 6-digit for cross-country comparison; national line if within one country |
Destination | Country |
Import value, latest full year | Value, source, year |
Trend | Direction over 3+ years |
Unit value vs your price | Higher, similar or lower |
Top supplier origins | Top 3 and whether your country is among them |
Distinct importers seen | Count and source |
Concentration | Top-3 share of visible shipments, or HHI if you calculated it |
Coverage | Complete, partial or unknown |
Next step | Shortlist buyers, check duty, or drop |
Rank markets on size, trend and fit together. A smaller, growing market with many visible importers can be a better first target than a large market controlled by a few incumbents.
EximAgent's Analyst works from shipment records and its company directory. You can ask it about market size and price trends, buyer concentration, who imports a product, and company profiles and similar companies. Its answers come with sources and say whether coverage is complete or partial.
Ask Analyst for market size and buyer concentration (see pricing for applicable charges).
When you have picked a market, Analyst's findings can give Outbound its starting context for an outreach campaign. Working in Cursor, Claude Code or Codex? Use the EximAgent CLI or connect the EximAgent connector.
EximAgent Research writes practical guides on finding buyers, reading trade data and checking HS codes, tariffs and sanctions.
Enter your email to receive the latest trade insights, guides, and HS-code explainers from EximAgent Blog.